Even worse if one also wants interactivity!
But why is D3 so hard/clunky to use? And what can be done about it?
Spoiler alert: Vue.js (or other modern front-end framework) to the rescue - if done right...
All code in the examples is available in this GitHub repository.
The Root of the Problem
In a nutshell, what makes D3 awkward to use is that, for historical reasons, it tries to do too much: most painfully, it uses an old way to do direct DOM manipulation (i.e. restructuring the page layout) - an operation that nowadays is superbly handled in a far more friendly way by modern front-end frameworks, such as Vue.js
Document Object Model (DOM) is a programming interface for web documents. In simple terms, it's the structure of the elements on a web page (text, images, etc.)
Let the front-end framework (such as Vue) handle it!
D3 is more than just about data visualization. As a consequence of D3 emerging before modern front-end frameworks, it had to "do it all" itself. As a result, it consists of several parts:
- DOM utilities: this part resembles the archaic jQuery, and absolutely does not belong in modern web pages!
- Data utilities/analysis: fine, but also available through other libraries, such as Lodash
- Data visualization: this is the key "good part" that we must tap into!
- Animation
For more detail, an excellent in-depth article: D3 is not a Data Visualization Library.
 |
| From "D3 is not a Data Visualization Library", by Elijah Meeks |
and then goes into a good amount of detail about each of the parts.
The take-home messages is the appealing prospect to "choose which parts of the [D3] library to learn and which parts to avoid".
But how exactly does one do that, in actual practice?
The Broad Picture
Anyone who's looking into creating custom D3 visualizations - as opposed to just picking a boiler-plate one from the vast D3 offerings (such as these) - is clearly someone with very specific/specialized needs. Someone who also probably needs interactivity, reactivity to changes in the data, and generally fine control over the front end. In short, a front-end programmer... or someone in a team that involves front-end programmers who are already using Vue.js or React, or another modern front-end framework. If your visualization needs are common and straightforward, you're in the wrong place!
Below, I will discuss in detail how to graft the "good parts" of D3 into the "scaffold" provided by Vue. A similar approach will probably work for other front-end frameworks.
A Warm-Up Example
The awkward "retro" quality of D3, when it's used to do it all, becomes painfully aware to anyone accustomed to a modern front-end framework. When - in addition to the graphing part - D3 tries to also manage user interactivity or some type of UI, it feels like a journey to the painful ol' days of jQuery (an early JavaScript library to manage the front end.)
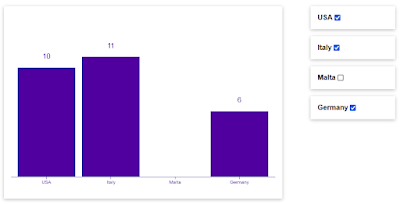 |
| Bar graph and a checkbox UI, all handled by D3 |
For example, an excellent in-depth first intro to D3 is a 3-part video series from 2020: all is good in the 1st and 2nd videos, which introduce making a bar graph with D3...
but in the final part, where the checkbox interactivity is added, ouch! It's painfully to revisit the old ways of doing such things prior to modern front-end frameworks. With minor tweaks I added, here's the code for this "test3" : HMTL (largely a placeholder, plus CSS) and the D3 JavaScript file, where most of the action takes place.
In the first part of the JS file, you can see D3 reaching into the DOM (a task that really belongs to the framework) in lines such as d3.select('svg') , which is reminiscent of the old jQuery world. The pain further increases in the 2nd half of the file, with the clunky pre-frameworks way of managing the UI!
In my test2 (files) I have a simpler example, with a bar graph but no checkboxes; much less awkward, when we're not trying to use D3 for the UI...
The even simpler test1 (files) has no "real" graphics (SVG code) at all: it emphasizes how D3 can be used - in a "retro" programming fashion - for any sort of general DOM manipulation.
SVG stands for Scalable Vector Graphics. In simple terms, it's the counterpart of HML tags for graphics elements, such as rectangles, lines and points. A good, detailed tutorial.
What D3 does is to generate the SVG code, and stick it in the right places on the page (this last function is best left to the front-end framework!)
How to keep the "good" D3 and ditch the "archaic" D3

I also came across a good but long-winded workshop, plus some articles that I found helpful but confusing (such as this one), and rare truly helpful articles like this one (which I'll revisit at the very end)... but mostly I found rehashes of the half-baked minimal integrations of D3 into Vue pages.
I ended up creating a series of code snapshots of a step-by-step process I took, to start with pure D3 ("I do it all, even what I don't do well"), and gradually wrestle away from D3 the parts that best belong to Vue - with the final result of a clean, easy-to-read (if you know Vue!) and reactive modern front end, with a sensible division of labor between D3 and Vue; in principle it could also be any other modern front-end framework.
A STEP-BY-STEP example: a D3 heatmap gradually turned into a clean D3 + Vue
FILES: in the repository, check out the files "heatmap1.htm" thru "heatmap8.htm", plus their .js counterparts when present, in the heatmap directory.
Not a Vue expert? No problem - you can simply clone the repository to your local machine, and open the HTML files in your browser: NOTHING TO INSTALL :)
1) heatmap1.htm is a pure D3 heatmap, taken straight out from this D3 graph gallery.
2) In heatmap2.htm, I add the Vue scaffold (a "root" element that I'm not yet using), and I replace the heatmap dataset with just a handful of values hardwired into the file.
Please note that I use the final release (2.6) of Vue version 2, stored in my repository.

3) In heatmap3.htm, I introduce a Vue component, <vue-heatmap-3> , in the file heatmap3_comp.js. All the data for the heatmap is now managed by Vue, and passed to the component, but the heatmap is still entirely produced, and inserted into the DOM, by D3.
The Vue component receives data from its parent, but is NOT reactive: the mounted() function gets called once, and that's the end of it!
(Note: I use the "template literals" format for Vue components, which I think is very readable, and requires no file compilation. Various alternatives are discussed in this excellent article: 7 Ways to Define a Component Template in Vue.js)
Many authors stop here in their weak integration of D3 and Vue... but this surely isn't the end of the story!
4) In heatmap4 (.htm and .js files), a different Vue component takes control of computed values and of most functions used by the original D3 code, except for the axes generation.
Vue takes control, but does not re-invent the wheel: it invokes the amazing functions provided by D3 libraries, for example for scaling or color mapping.
The DOM manipulation is still being done by D3, for now.
Why are we leaving the axes for last? Because, alas, the creation of the axes in D3 is hopelessly entangled with the DOM modification, rather than being a truly modular element that just produces the SVG code for the axes without messing around with the DOM...
5) In heatmap5, the creation of the actual heatmap is separated from the creation of the overall graph and axes. Also, a Vue watch is instituted for the prop 'my_data', which now becomes reactive: it changes the heatmap as needed, when the data is modified.
The screenshot below was taken using the (highly, highly recommended!) Vue Devtools extension, seen here in Firefox. If you change the "my_data" array in the Vue root component, you'll see the heatmap instantly change. (Note: make sure to edit the whole array, as show near the bottom of the picture; if you expand the arrow next to my_data, and just change one array element, Vue doesn't detect that.)


Reactivity will happen organically once we banish D3 from getting its dirty little paws directly into the DOM.
6) In heatmap6, Vue takes control of the SVG element (in the template of the Vue component), while D3 handles the CONTENTS of the SVG element.
7) In heatmap7, most of the plot is now handled directly by Vue, in an SVG code template (very easy to read and modify), using Vue iteration over the heatmap rectangles, and Vue computations of plot parameters with D3 libraries.
Many D3 libraries are awesome, and we're continuing to utilize them, while at the same time banishing the archaic part of D3
The axes still remain a DOM manipulation directly done by D3, and require special handling to be reactive to changes in the data (while the Vue-controlled part is automatically reactive.)
8) In heatmap8, the last direct DOM manipulation has been wrestled out of D3, hallelujah!

As mentioned earlier, the D3 axes generator is hopelessly entangled with the DOM manipulation, and therefore has to be ditched.
It's pretty easy, however, to create an SVG axes generator; I ported to JavaScript an old SVG axes generator I had created in PHP many years ago, and tweaked it to give almost identical visuals to the built-in one in D3 (I changed the axes to grey, but you can tweak that and more in the CSS, which I have in the html file.) The code can be found in the SVG_helper library; with just a light knowledge of SVG, one can easily tweak it, to get the axes any way one wants them, or to factor out to convenient JavaScript calls any other custom SVG code that one needs.
The heatmap also includes a few extra lines (middle, top and right), to demonstrate various ways of adding SVG elements in the template of the Vue component.
All the extra code to create reactivity is now taken out: the page is organically reactive because it utilizes Vue correctly - rather than the earlier "backseat driving" by D3!
Here's an example of reactivity to the enlargement of "outer_width":

All Said and Done...
The final result (files heatmap8.htm and heatmap8_comp.js) utilizes standard D3 libraries for scaling and color mapping, plus a simple SVG helper library (just for the axes) that could be easily customized to one's very specific needs.
[May 2022 update: an improved SVG helper library is now being expanded and maintained by the open-source project Life123; details at the very end of this article!]
Is it simpler than the starting point (heatmap1.htm)? Well, if one was aiming to do nothing more than the heatmap per se, then the original D3 implementation, or the light Vue integration from step3, might be just fine.
But here I've been addressing the needs of people who have to go beyond existing boiler-plate solutions, and require a high level of control of the graphics as well as the UI surrounding it.
The original pure-D3 heatmap is OK as a standalone element, but the final heatmap8 in our example above is fully reactive to changes in the data, and is completely in Vue's control, with the SVG very accessible in template form - and so, it's very ready to be easily expanded with UI controls, interactivity and customization, with just a normal Vue skillset, plus a light knowledge of SVG and of the needed D3 libraries. Anything not provided by a standard D3 library, could be custom-designed and added to the SVG helper library.
 |
| D3 at the service of the front-end framework! |
Now that we have a full integration of the heatmap graphics with Vue, we can easily add all sorts of UI controls and interactivity: we're in "Vue territory" and we can draw upon its power and convenience.
For example, it's a breeze to add a slider that lets the user select a start bin to display in the heatmap. I'm calling the file heatmap8_slider.htm, rather than heatmap9, for clarity - because we're still using the same Vue component (heatmap8_comp.js) to draw the actual heatmap. I also added more data to better see the effect, and I'm showing the raw data - being sent to the graphing component - under the image.

Two More Examples
Having discussed the step-by-step process to wrestle out of D3 what is best done by the front-end framework, here are two more complete examples of D3 fully and sensibly integrated into Vue:

Based on this video.

2) An "interactive star". A slider determines the number of rays. Code.
Adapted from this very helpful detailed article.
See More
[May 2022 update] The open-source project Life123 is exactly an example of something that needs interactive, very customized ad-hoc visualization. You'll find a growing list of Vue components using D3 libraries in the repository for that project: GitHub directory with Vue components, their CSS files and HTML test files.
Maybe get involved in contributing Vue/D3 components for that open source project?
Comments
Post a Comment